Loading the public survey summary…
An ECOllaboration program ↗
One year of PlatyTracker · 25 September 2026
PlatyTracker Data Explorer
A closer look at our creeks.
All-program totals
- 994
- completed surveys
- 374
- sessions with a sighting
- 620
- sessions with no sighting
Timeline: 25 September 2025–22 September 2026 · These are monitoring records, not a count of individual platypus.
Map
Explore the monitoring map
Find a creek or river to see where our volunteers have monitored and what they recorded. Points mark monitoring locations; they don’t show where a particular platypus lives.
Filter by drainage basinSome hinterland creeks drain inland toward the Brisbane River system.
Choose a waterway
Waterways
At least one sighting recordedNo sightings recordedPrivate property — no public access permittedWaterwayNumbers show completed monitoring sessions
Data
What volunteers recorded
Explore when volunteers visited, what they saw and the habitat they described. Sightings are records of visits, not a count of individual platypus.
Timeline: 25 September 2025–22 September 2026
Figures count surveys from 25 September 2025, when PlatyTracker started.
All waterways · These charts show the whole program, regardless of your map selection.
Reading the results & data sources
Completed surveys include visits with and without a sighting. Repeated sightings may be the same animal. Survey effort varies between places and months: these results cannot estimate population size, prove absence or demonstrate a cause. No sighting does not prove a platypus was absent.
PlatyTracker started on 25 September 2025. Earlier test surveys are not included in any figure, chart or map. The record runs from 26 September 2025 to 22 September 2026; the final month may be incomplete.
Source: ECOllaboration PlatyTracker volunteer monitoring records. Program information at ECOllaboration.
How to read these charts
Check how many visits were made when comparing sightings. Finding two things in the same records doesn’t tell us that one caused the other.
How to interpret these results →Connections
What does a platypus need?
Follow the connections between a platypus, its food and a healthy creek. Then explore what happens when conditions change.

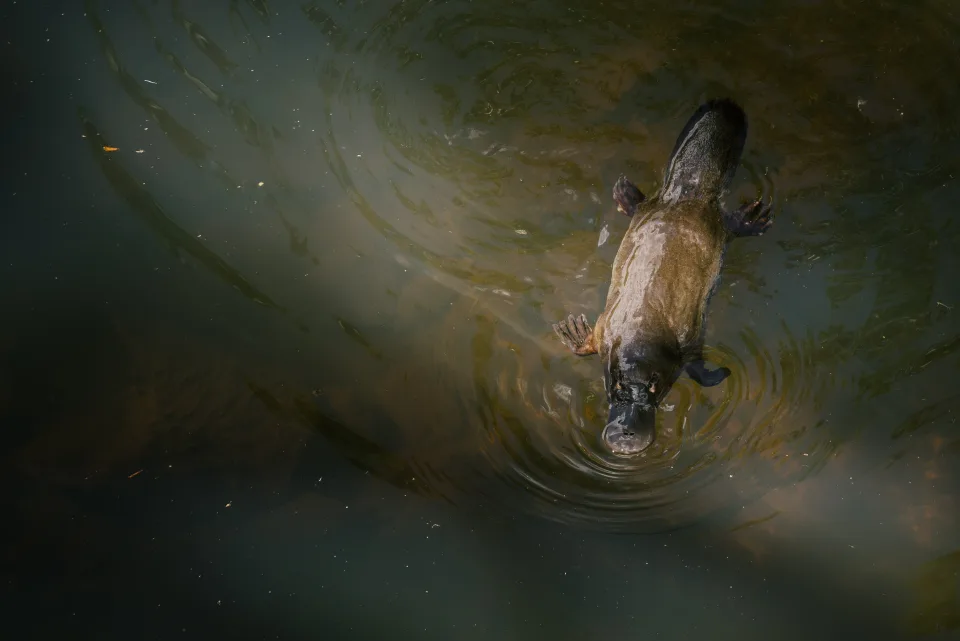
AI-generated educational illustration, informed by photography by Brandon Rooney (Ecollaboration volunteer).
Related topics — not pictured